Lump Sum Calculator
Enter a one-time investment amount, an expected return rate, and how long you'll stay invested to see what it could grow into.
Nothing you type here is sent to a server or saved — every number above is calculated by your browser, on your device.
What This Calculator Actually Tells You
Say you've just received a bonus, sold a property, or cleared out an old fixed deposit that's about to mature. Now there's a lump sum sitting in your account, and you're wondering what it could turn into if you invested it instead of leaving it in a savings account.
That's the exact question this tool answers. Enter the amount, an expected annual return, and how many years you plan to stay invested, and it projects the maturity value using compound interest — the same math behind a mutual fund's long-term growth chart.
It won't tell you which fund to buy or whether 12% is a realistic assumption for your situation (there's more on that further down). What it does is turn a return-rate guess into an actual rupee figure, so you're working from a number instead of a feeling.
How the Math Works
A lump sum investment doesn't get topped up every month the way a SIP does — the entire amount goes in on day one and then compounds on itself, year after year. The formula for that is:
M = P × (1 + r)n
- M — Maturity amount, what you end up with
- P — Principal, the amount you invest up front
- r — Expected annual return, written as a decimal (12% becomes 0.12)
- n — Number of years invested
How compounding accelerates over time
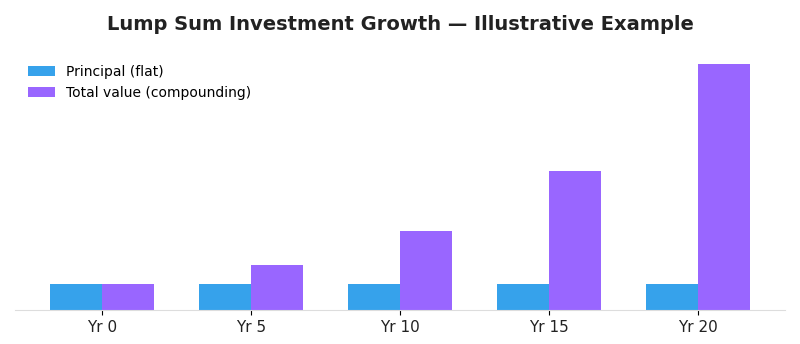
The gap between the two lines is entirely the effect of compounding — it barely shows in the early years and then widens fast, which is why the return you earn on your returns matters just as much as your original investment.
Here's how that plays out with a real number. Say you put ₹10,00,000 into an equity mutual fund and it averages a 12% annual return over 20 years — a figure sometimes cited as a long-run historical average for Indian equity funds, though any individual fund's actual return will vary from that.
Step by step:
1. Inputs
- Principal (P) = ₹10,00,000
- Expected return (r) = 12% = 0.12
- Duration (n) = 20 years
2. Apply the formula
M = 10,00,000 × (1 + 0.12)20
M = 10,00,000 × 9.6466
M ≈ ₹96,46,000
| Description | Amount |
|---|---|
| Invested amount | ₹10,00,000 |
| Estimated returns | ₹86,46,000 |
| Total value (M) | ₹96,46,000 |
Not everyone is starting with ten lakh, so here's a smaller version of the same math: ₹50,000 invested at 10% for 10 years grows to roughly ₹1,29,687 — meaning the returns alone (₹79,687) end up bigger than what you originally put in. That's the same compounding effect, just at a scale that's easier to picture if you're starting smaller.
A Few More Growth Scenarios
Rather than rely on one example, it helps to see how the outcome shifts as the amount, rate, and duration change. Every figure below uses the same formula as the calculator above — plug the same numbers in and you should land on the same result.
| Investment | Return Rate | Duration | Approx. Maturity Value |
|---|---|---|---|
| ₹50,000 | 8% | 10 years | ₹1,07,946 |
| ₹1,00,000 | 10% | 15 years | ₹4,17,725 |
| ₹5,00,000 | 12% | 20 years | ₹48,23,000 |
| ₹10,00,000 | 12% | 20 years | ₹96,46,000 |
| ₹20,00,000 | 14% | 25 years | ₹5.29 crore |
These are illustrative projections at assumed rates, not promised returns. Actual investments can underperform or outperform any of the rates shown here.
Lump Sum or SIP — Which One Fits You?
This isn't really a question of which one is "better" — it's a question of what money you have and how comfortable you are with market timing. If you're investing money you already have sitting idle, a lump sum lets the entire amount start compounding immediately. If you're investing out of your monthly salary, a SIP simply matches how the money actually arrives, and it spreads your entry price out so a single bad week in the market doesn't define your whole return.
| Criteria | SIP | Lump Sum |
|---|---|---|
| How money goes in | Fixed amount every month | Full amount, all at once |
| Best suited for | Regular income (salary, freelance retainer) | Idle funds — bonus, inheritance, maturing FD |
| Market timing risk | Lower — spread across many entry points | Higher — one entry point for the whole amount |
| Flexibility | Easy to pause, increase, or stop | Locked in once invested |
| Discipline required | Builds a monthly habit | One decision, then it's done |
| Try it | Open the SIP Calculator | You're already here |
Using a Lump Sum for Retirement
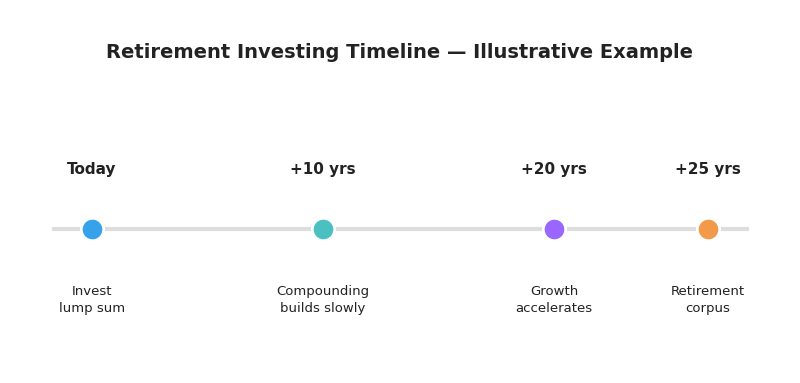
Retirement is where lump sum investing tends to shine, mainly because time is the one variable compounding needs the most of. Money invested at 35 for a retirement at 60 has 25 years to compound; the same amount invested at 50 only gets 10. That gap in years matters more than most people expect — it's usually bigger than the gap you'd get from chasing a slightly higher return rate.
Run the calculator with a few different durations — 15, 20, and 25 years — using the same amount and rate, and watch how much of the final total shows up only in the last five or ten years. That's compounding doing the heavy lifting late, which is exactly why starting earlier tends to matter more than starting bigger.
Mistakes Worth Avoiding With a Lump Sum
A calculator can show you the math, but it can't stop you from making a costly decision with the money. These are the mistakes that come up most often:
| Mistake | Why it hurts | A steadier approach |
|---|---|---|
| Investing the entire amount right after a big market run-up | You lock in a high entry price for 100% of your money at once | Consider splitting it into 3–6 monthly tranches instead of one shot |
| Skipping the emergency fund first | You may have to exit the investment early, at a bad time, to cover an emergency | Set aside 3–6 months of expenses before investing the rest |
| Using a fund's best-ever year as your expected rate | It sets an expectation the fund is unlikely to repeat consistently | Use a long-run average, and test a lower rate too |
| Ignoring how the investment will be taxed | The after-tax amount can be noticeably lower than the number this calculator shows | Check the current tax treatment for that specific investment type before committing |
| Never revisiting the plan | Your goals, timeline, or risk tolerance can shift years later without you noticing | Re-check the numbers at least once a year |
How to Use This Calculator
Three fields, one result:
- Enter your one-time investment amount
- Set an expected annual return rate
- Choose how many years you'll stay invested
The results update instantly as you type or drag the sliders, and the chart below switches between a bar and line view so you can see the year-by-year climb, not just the final number.
Frequently Asked Questions
Last updated: 7 July 2026
Related Calculators
- SIP Calculator — see what regular monthly investments could grow into